ArcelorMittal SA (MT)

Currency in EUR
56.78
+2.24(+4.11%)
Closed·
MT is not included in our AI-picked strategies. See which stocks are.
Fair Value
Day's Range
54.4056.78
52 wk Range
25.7457.42
Key Statistics
Prev. Close
54.54
Open
55
Day's Range
54.4-56.78
52 wk Range
25.74-57.42
Volume
2.8M
Average Volume (3m)
2.51M
1-Year Change
112.9782%
Book Value / Share
62.74
Fair Value
unlockUnlock
Fair Value Upside
unlockUnlock
MT Scorecardpro icon
Company’s Health
Unlock
Fair Value
Unlock Price
Fair Price
Upside
Price Target
56.47
Downside
-0.54%
Members' Sentiments
Bearish
Bullish
ProTips
Suffers from weak gross profit margins

ArcelorMittal SA News & Analysis

Show more

Technical Analysis

Summary
Strong Sell
Sell
Neutral
Buy
Strong Buy
Strong Buy
Technical Indicators
Strong Buy
Moving Averages
Strong Buy

Analyst Ratings

10 Buy
3 Hold
1 Sell
Ratings:
14 analysts
Overall Consensus
Buy

Analysts 12-Month Price Target:

Average 56.47
(-0.54% Downside)
Firm
ArticlePositionPrice TargetUpside / DownsideFrom Price TargetActionDate
Citi
Buy67.00+18.00%66.00Maintain20-05-2026
JPMorgan
Sell45.00-20.75%44.00Maintain01-05-2026
BofA Securities
Buy62.00+9.19%65.00Maintain30-04-2026
JPMorgan
Sell44.00-22.51%40.00Maintain27-04-2026
UBS
Hold45.00-20.75%35.40Maintain31-03-2026

Earnings

Latest Release
30-04-2026
EPS / Forecast
0.64 / 0.61
Revenue / Forecast
13.18B / 13.73B
EPS Revisions
Last 90 days

Dividends

Payout Ratio
Payout ratio (TTM)
Earnings retained
EPS 3.82%
Dividend Yield
0.81%
Industry Median 1.20%
Annualised payout
0.44
Paid quarterly
5-Years Growth
+14.87%
Growth Streak

MT Income Statement

Compare MT to Peers and Sector

Metrics to compare
MT
Peers
Sector
Relationship
P/E Ratio
16.6x23.3x3.2x
PEG Ratio
0.110.070.00
Price/Book
0.9x1.8x1.6x
Price / LTM Sales
0.8x0.7x1.3x
Upside (Analyst Target)
7.0%2.1%31.6%
Fair Value Upside
Unlock1.3%0.8%Unlock

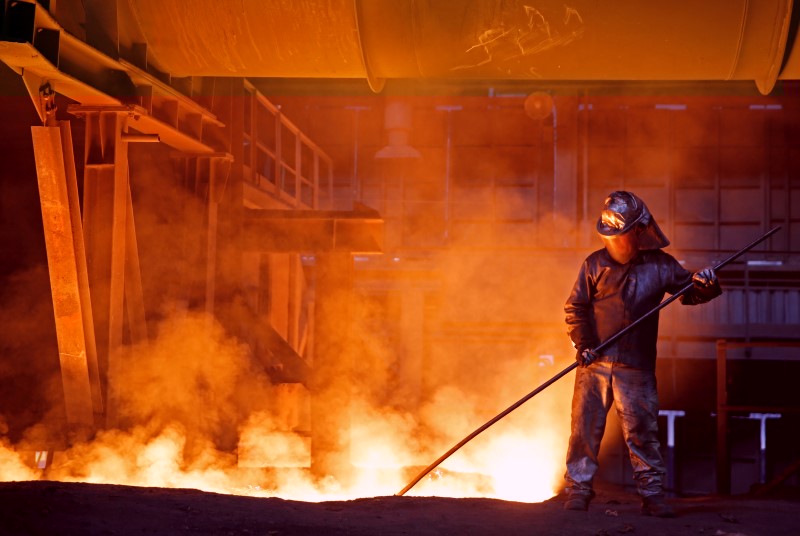
ArcelorMittal S.A., together with its subsidiaries, operates as integrated steel and mining companies in the Americas, Europe, Asia, and Africa. It offers semi-finished flat products, including slabs; finished flat products comprising plates, hot- and cold-rolled coils and sheets, hot-dipped and electro-galvanized coils and sheets, tinplate, and color coated coils and sheets; semi-finished long products, such as blooms and billets; finished long products consisting of bars, wire-rods, structural sections, rails, sheet piles, and wire-products; and seamless and welded pipes and tubes. The company also provides mining products, such as iron ore lumps, fines, concentrate, pellets, and sinter feeds; and coking coal. It sells its products to various customers in the automotive, appliance, engineering, construction, energy, and machinery industries through a centralized marketing organization, and distributors. The company operates iron ore mining activities in Brazil, Bosnia, Liberia, Mexico, South Africa, and Ukraine, as well as in India and in Canada. ArcelorMittal S.A. was founded in 1976 and is headquartered in Luxembourg, Luxembourg.

Employees
125554

Ownership

Ownership Overview

Type
Common Stock Held% of Shares OutstandingMarket Value
Mutual Funds & ETFs
168.12M22.09%9.17B
Other Institutional Investors
361.99M47.56%19.74B
Public Companies & Retail Investors
231.01M30.35%12.60B
Total
761.12M100.00%41.51B

Top Holders

Holder
% of holding
Shares Held
Date Reported
Value (In 1,000s)
Grandel Pte Limited44.60%33,94,98,9431,85,16,272
BlackRock, Inc.3.23%2,45,86,54813,40,950

FAQ

What Is the ArcelorMittal (MT) Share Price Today?

The ArcelorMittal share price today is 56.78.

What is the current ArcelorMittal (MT) share price and day range?

As of 23-05-2026, the ArcelorMittal share price is 56.78, with a previous close of 54.54. The share price has ranged from 54.40 to 56.78 today, while the 52-week range spans from 25.74 to 57.42.

What Is the ArcelorMittal Market Cap?

As of today, ArcelorMittal market cap is 43.22B.

Does ArcelorMittal Pay Dividends? What's The Current Dividend Yield?

The ArcelorMittal dividend yield is 0.81%.

What Is the ArcelorMittal (MT) Share Price Target?

The average 12-month share price target for ArcelorMittal is 56.47, with a high estimate of 66.9490649 and a low estimate of 44.48763251. 10 analysts recommend buying, while 1 suggest selling, with an overall rating of Buy and -0.54% Downside potential.

What Is ArcelorMittal's Earnings Per Share (TTM)?

The ArcelorMittal EPS (TTM) is 3.82.

When Is the Next ArcelorMittal Earnings Date?

ArcelorMittal will release its next earnings report on 30-07-2026.

From a Technical Analysis Perspective, Is MT a Buy or Sell?

Based on moving averages and other technical indicators, the daily buy/sell signal is Strong Buy.

What Stock Exchange Does ArcelorMittal Trade On?

ArcelorMittal is listed and trades on the Amsterdam Stock Exchange.

What Is the Stock Symbol for ArcelorMittal?

The stock symbol for ArcelorMittal is "MT."

How Many Times Has ArcelorMittal Stock Split?

ArcelorMittal has split 2 times.

How Many Employees Does ArcelorMittal Have?

ArcelorMittal has 125554 employees.
Risk Disclosure: Trading in financial instruments and/or cryptocurrencies involves high risks including the risk of losing some, or all, of your investment amount, and may not be suitable for all investors. Prices of cryptocurrencies are extremely volatile and may be affected by external factors such as financial, regulatory or political events. Trading on margin increases the financial risks.
Before deciding to trade in financial instrument or cryptocurrencies you should be fully informed of the risks and costs associated with trading the financial markets, carefully consider your investment objectives, level of experience, and risk appetite, and seek professional advice where needed.
Fusion Media would like to remind you that the data contained in this website is not necessarily real-time nor accurate. The data and prices on the website are not necessarily provided by any market or exchange, but may be provided by market makers, and so prices may not be accurate and may differ from the actual price at any given market, meaning prices are indicative and not appropriate for trading purposes. Fusion Media and any provider of the data contained in this website will not accept liability for any loss or damage as a result of your trading, or your reliance on the information contained within this website.
It is prohibited to use, store, reproduce, display, modify, transmit or distribute the data contained in this website without the explicit prior written permission of Fusion Media and/or the data provider. All intellectual property rights are reserved by the providers and/or the exchange providing the data contained in this website.
Fusion Media may be compensated by the advertisers that appear on the website, based on your interaction with the advertisements or advertisers.
© 2007-2026 - Fusion Media Limited. All Rights Reserved.