National Agriculture Development Co (6010)

Currency in SAR
16.10
0.00(0.00%)
Closed·
6010 is not included in our AI-picked strategies. See which stocks are.
Fair Value
Day's Range
16.0716.18
52 wk Range
15.8022.80
Key Statistics
Bid/Ask
16.09 / 16.10
Prev. Close
16.1
Open
16.11
Day's Range
16.07-16.18
52 wk Range
15.8-22.8
Volume
805.29K
Average Volume (3m)
798.77K
1-Year Change
-29.1373%
Fair Value
unlockUnlock
Fair Value Upside
unlockUnlock
6010 Scorecardpro icon
Company’s Health
Unlock
Fair Value
Unlock Price
Fair Price
Upside
Price Target
22.30
Upside
+38.51%
Members' Sentiments
Bearish
Bullish
ProTips
RSI suggests the stock is in oversold territory
Show more

Technical Analysis

Summary
Strong Sell
Sell
Neutral
Buy
Strong Buy
Strong Sell
Technical Indicators
Strong Sell
Moving Averages
Strong Sell

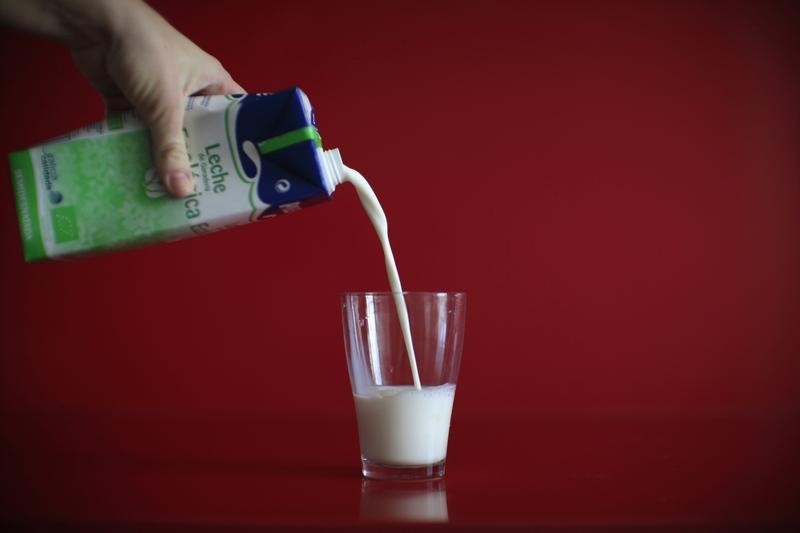
The National Agricultural Development Company engages in the production of agricultural and livestock products in the Kingdom of Saudi Arabia and internationally. The company operates in three segments, Dairy and Foods, Agriculture, and Protein. It is also involved in the reclamation of agricultural land; food processing; and marketing, and distribution of its products. In addition, the company offers milk, cream, and dessert products; cheese, labneh, and butter; and yoghurt and Laban. Further, it provides juices and nectar; chilled, frozen, and fresh red meat, including beef, lamb, and mutton; and vegetables and olive oil. The National Agricultural Development Company was incorporated in 1978 and is headquartered in Riyadh, Saudi Arabia.

Employees
4595

Compare 6010 to Peers and Sector

Metrics to compare
6010
Peers
Sector
Relationship
P/E Ratio
11.8x15.0x12.0x
PEG Ratio
−0.23−0.100.03
Price/Book
1.0x2.0x1.5x
Price / LTM Sales
1.3x2.0x0.9x
Upside (Analyst Target)
33.5%25.5%21.3%
Fair Value Upside
Unlock14.2%11.8%Unlock

Analyst Ratings

3 Buy
0 Hold
0 Sell
Ratings:
3 analysts
Overall Consensus
Buy

Analysts 12-Month Price Target:

Average 22.30
(+38.51% Upside)
Firm
ArticlePositionPrice TargetUpside / DownsideFrom Price TargetActionDate

Earnings

Latest Release
23-04-2026
EPS / Forecast
-- / --
Revenue / Forecast
1.05B / --
EPS Revisions
Last 90 days

6010 Income Statement

FAQ

What Is the NADEC (6010) Share Price Today?

The NADEC share price today is 16.10.

What is the current NADEC (6010) share price and day range?

As of 30-04-2026, the NADEC share price is 16.10, with a previous close of 16.10. The share price has ranged from 16.07 to 16.18 today, while the 52-week range spans from 15.80 to 22.80.

What Is the NADEC Market Cap?

As of today, NADEC market cap is 4.51B.

What Is the NADEC (6010) Share Price Target?

The average 12-month share price target for NADEC is 22.30, with a high estimate of 25.7 and a low estimate of 19.7. 3 analysts recommend buying, while 0 suggest selling, with an overall rating of Buy and +38.51% Upside potential.

What Is NADEC's Earnings Per Share (TTM)?

The NADEC EPS (TTM) is 1.27.

When Is the Next NADEC Earnings Date?

NADEC will release its next earnings report on 27-07-2026.

From a Technical Analysis Perspective, Is 6010 a Buy or Sell?

Based on moving averages and other technical indicators, the daily buy/sell signal is Strong Sell.

What Stock Exchange Does NADEC Trade On?

NADEC is listed and trades on the Saudi Arabia Stock Exchange.

What Is the Stock Symbol for NADEC?

The stock symbol for NADEC is "6010."

How Many Times Has NADEC Stock Split?

NADEC has split 7 times.

How Many Employees Does NADEC Have?

NADEC has 4595 employees.
Risk Disclosure: Trading in financial instruments and/or cryptocurrencies involves high risks including the risk of losing some, or all, of your investment amount, and may not be suitable for all investors. Prices of cryptocurrencies are extremely volatile and may be affected by external factors such as financial, regulatory or political events. Trading on margin increases the financial risks.
Before deciding to trade in financial instrument or cryptocurrencies you should be fully informed of the risks and costs associated with trading the financial markets, carefully consider your investment objectives, level of experience, and risk appetite, and seek professional advice where needed.
Fusion Media would like to remind you that the data contained in this website is not necessarily real-time nor accurate. The data and prices on the website are not necessarily provided by any market or exchange, but may be provided by market makers, and so prices may not be accurate and may differ from the actual price at any given market, meaning prices are indicative and not appropriate for trading purposes. Fusion Media and any provider of the data contained in this website will not accept liability for any loss or damage as a result of your trading, or your reliance on the information contained within this website.
It is prohibited to use, store, reproduce, display, modify, transmit or distribute the data contained in this website without the explicit prior written permission of Fusion Media and/or the data provider. All intellectual property rights are reserved by the providers and/or the exchange providing the data contained in this website.
Fusion Media may be compensated by the advertisers that appear on the website, based on your interaction with the advertisements or advertisers.
© 2007-2026 - Fusion Media Limited. All Rights Reserved.