Indian Metals and Ferro Alloys Ltd (IMFA)

NSE
Currency in INR
722.30
+12.35(+1.74%)
Closed·
IMFA Scorecard
Full Analysis
Holds more cash than debt on its balance sheet
IMFA is not included in our AI-picked strategies. See which stocks are.
Fair Value
Day's Range
701.30727.85
52 wk Range
549.80998.80
Key Statistics
Edit
Bid/Ask
722.30 / 723.00
Prev. Close
709.95
Open
709.85
Day's Range
701.3-727.85
52 wk Range
549.8-998.8
Volume
61.22K
Average Volume (3m)
114.14K
1-Year Change
-8.69%
Fair Value
unlockUnlock
Fair Value Upside
unlockUnlock
IMFA Scorecardpro icon
Company’s Health
Unlock
Fair Value
Unlock Price
Fair Price
Upside
Analysts Sentiment
Currently not supported.
Members' Sentiments
Bearish
Bullish
ProTips
Impressive gross profit margins
Show more

Indian Met Company Profile

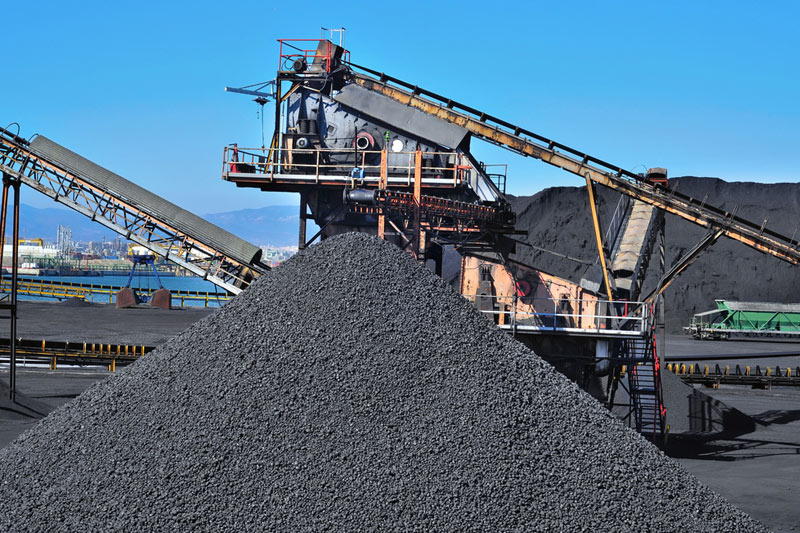
Indian Metals and Ferro Alloys Limited engages in the production and sale of ferro chrome in India and internationally. The company operates through three segments: Ferro Alloys, Power, and Mining segments. It operates a power generation plant with a total capacity of 204.55 MW, including 4.55 MWp from solar; and two chrome ore mines, as well as manufacturing plant for low density aggregates and fly ash bricks for use in road construction and cement manufacturing units. The company offers its products to stainless steel manufacturers and international traders. It exports its products to South Korea, China, Taiwan, and Japan. The company was incorporated in 1961 and is headquartered in Bhubaneswar, India.

Employees
2101
Market
India

Compare IMFA to Peers and Sector

Metrics to compare
IMFA
Peers
Sector
Relationship
P/E Ratio
10.3x32.5x1.7x
PEG Ratio
−2.570.590.00
Price/Book
1.7x3.4x1.6x
Price / LTM Sales
1.5x1.8x1.2x
Upside (Analyst Target)
-9.3%25.3%
Fair Value Upside
Unlock1.0%3.9%Unlock

Dividends

Payout Ratio
Payout ratio (TTM)
Earnings retained
EPS 70.19%
Dividend Yield
2.77%
Industry Median 5.21%
Annualised payout
20.00
Paid unevenly
5-Years Growth
-
Growth Streak

Earnings

Latest Release
May 21, 2025
EPS / Forecast
8.77 / --
Revenue / Forecast
5.84B / --
EPS Revisions
Last 90 days

IMFA Income Statement

FAQ

What Is the Indian Met (IMFA) Stock Price Today?

The Indian Met stock price today is 722.30.

What Stock Exchange Does Indian Met Trade On?

Indian Met is listed and trades on the India National Stock Exchange stock exchange.

What Is the Stock Symbol for Indian Met?

The stock symbol for Indian Met is "IMFA."

Does Indian Met Pay Dividends? What’s The Current Dividend Yield?

The Indian Met dividend yield is 2.77%.

What Is the Indian Met Market Cap?

As of today, Indian Met market cap is 38.92B.

What Is Indian Met's Earnings Per Share (TTM)?

The Indian Met EPS (TTM) is 70.19.

From a Technical Analysis Perspective, Is IMFA a Buy or Sell?

Based on moving averages and other technical indicators, the daily buy/sell signal is Strong Buy.

How Many Times Has Indian Met Stock Split?

Indian Met has split 1 times.

How Many Employees Does Indian Met Have?

Indian Met has 2101 employees.

What is the current trading status of Indian Met (IMFA)?

As of 18 Jun 2025, Indian Met (IMFA) is trading at a price of 722.30, with a previous close of 709.95. The stock has fluctuated within a day range of 701.30 to 727.85, while its 52-week range spans from 549.80 to 998.80.
Risk Disclosure: Trading in financial instruments and/or cryptocurrencies involves high risks including the risk of losing some, or all, of your investment amount, and may not be suitable for all investors. Prices of cryptocurrencies are extremely volatile and may be affected by external factors such as financial, regulatory or political events. Trading on margin increases the financial risks.
Before deciding to trade in financial instrument or cryptocurrencies you should be fully informed of the risks and costs associated with trading the financial markets, carefully consider your investment objectives, level of experience, and risk appetite, and seek professional advice where needed.
Fusion Media would like to remind you that the data contained in this website is not necessarily real-time nor accurate. The data and prices on the website are not necessarily provided by any market or exchange, but may be provided by market makers, and so prices may not be accurate and may differ from the actual price at any given market, meaning prices are indicative and not appropriate for trading purposes. Fusion Media and any provider of the data contained in this website will not accept liability for any loss or damage as a result of your trading, or your reliance on the information contained within this website.
It is prohibited to use, store, reproduce, display, modify, transmit or distribute the data contained in this website without the explicit prior written permission of Fusion Media and/or the data provider. All intellectual property rights are reserved by the providers and/or the exchange providing the data contained in this website.
Fusion Media may be compensated by the advertisers that appear on the website, based on your interaction with the advertisements or advertisers.
© 2007-2025 - Fusion Media Limited. All Rights Reserved.