Hexagon AB ADR (HXGBY)

Currency in USD
11.03
-0.07(-0.59%)
Delayed Data·
HXGBY is not included in our AI-picked strategies. See which stocks are.
Fair Value
Day's Range
10.9811.13
52 wk Range
9.1912.85
Key Statistics
Prev. Close
11.1
Open
11.13
Day's Range
10.98-11.13
52 wk Range
9.19-12.85
Volume
28.36K
Average Volume (3m)
569.25K
1-Year Change
16.2276%
Book Value / Share
5.18
Fair Value
unlockUnlock
Fair Value Upside
unlockUnlock
HXGBY Scorecardpro icon
Company’s Health
Unlock
Fair Value
Unlock Price
Fair Price
Upside
Price Target
12.55
Upside
+13.78%
Members' Sentiments
Bearish
Bullish
ProTips
Trading at a high earnings multiple

Hexagon AB ADR News & Analysis

Show more

Technical Analysis

Summary
Strong Sell
Sell
Neutral
Buy
Strong Buy
Neutral
Technical Indicators
Strong Sell
Moving Averages
Buy

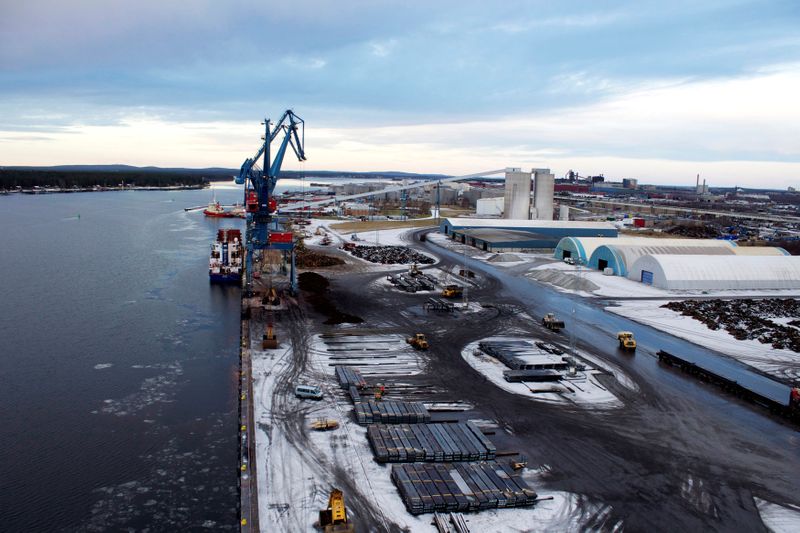
Hexagon AB (publ) provides geospatial and industrial enterprise solutions worldwide. It operates in Manufacturing Intelligence, Geosystems, Autonomous Solutions and Octave segments. The company provides autonomy and perception, enterprise software for farms, GNSS positioning, and machine control; airborne and mobile mapping, geospatial content, laser scanning, ERIDAA imagin, lucaid, and M.app enterprise; and asset lifecycle information management, design and visualization, engineering and schematics, enterprise project performance, operations and maintenance, OT/ICS cyber security, and smart digital reality, as well as procurement, fabrication, and construction services. It offers automated measurement systems, CAD/CAM and production software, CAE software, coordinate measuring machines, metrology software, portable measuring systems, quality assurance software, and service and support services. In addition, the company provides evaluation, planning and design; drill and blast; load and haul; mine survey and monitoring; processing; reclamation; operational safety; autonomous operations; and multi-senor technology insights services. Further, it offers anti-jam systems, anti-jam systems, correction services, GNSS and SMART antennas, GNSS/INS receivers and post processing, resilience and integrity technology, and visualization software; HxGN Oncall, Connect, and dC3; forensics and investigations; and AEC software, documentation and verification solutions, total stations, GNNS systems, survey software, detection systems, digital realities platform, monitoring solutions, and airborne solutions. It serves agriculture, geospatial, industrial asset lifecycle, manufacturing, mining, positioning, safety, security, and surveillance industries. The company was founded in 1975 and is headquartered in Stockholm, Sweden.

Employees
16118

Compare HXGBY to Peers and Sector

Metrics to compare
HXGBY
Peers
Sector
Relationship
P/E Ratio
12.4x21.4x13.0x
PEG Ratio
0.12−0.620.01
Price/Book
2.1x1.7x2.4x
Price / LTM Sales
4.7x0.7x2.4x
Upside (Analyst Target)
13.1%31.7%22.0%
Fair Value Upside
Unlock26.2%3.0%Unlock

Analyst Ratings

1 Buy
0 Hold
0 Sell
Ratings:
1 analysts
Overall Consensus
Strong Buy

Analysts 12-Month Price Target:

Average 12.55
(+13.78% Upside)
Firm
ArticlePositionPrice TargetUpside / DownsideFrom Price TargetActionDate

Dividends

Payout Ratio
Payout ratio (TTM)
Earnings retained
EPS 0.23%
Dividend Yield
0.89%
Industry Median 1.34%
Annualised payout
0.10
Paid unevenly
5-Years Growth
+9.24%
Growth Streak

Earnings

Latest Release
23-04-2026
EPS / Forecast
0.08 / 0.11
Revenue / Forecast
1.13B / 1.49B
EPS Revisions
Last 90 days

HXGBY Income Statement

FAQ

What Is the Hexagon ADR (HXGBY) Share Price Today?

The Hexagon ADR share price today is 11.03 EUR.

What is the current Hexagon ADR (HXGBY) share price and day range?

As of 24-04-2026, the Hexagon ADR share price is 11.03 EUR, with a previous close of 11.10 EUR. The share price has ranged from 10.98 to 11.13 EUR today, while the 52-week range spans from 9.19 to 12.85 EUR.

What Is the Hexagon ADR Market Cap?

As of today, Hexagon ADR market cap is 30.33B.

Does Hexagon ADR Pay Dividends? What's The Current Dividend Yield?

The Hexagon ADR dividend yield is 0.89%.

What Is the Hexagon ADR (HXGBY) Share Price Target?

The average 12-month share price target for Hexagon ADR is 12.55 EUR, with a high estimate of 12.55 EUR and a low estimate of 12.55 EUR. 1 analysts recommend buying, while 0 suggest selling, with an overall rating of Strong Buy and +13.78% Upside potential.

What Is Hexagon ADR's Earnings Per Share (TTM)?

The Hexagon ADR EPS (TTM) is 0.23.

When Is the Next Hexagon ADR Earnings Date?

Hexagon ADR will release its next earnings report on 29-07-2026.

From a Technical Analysis Perspective, Is HXGBY a Buy or Sell?

Based on moving averages and other technical indicators, the daily buy/sell signal is Strong Buy.

What Stock Exchange Does Hexagon ADR Trade On?

Hexagon ADR is listed and trades on the OTC Markets.

What Is the Stock Symbol for Hexagon ADR?

The stock symbol for Hexagon ADR is "HXGBY."

How Many Times Has Hexagon ADR Stock Split?

Hexagon ADR has split 1 times.

How Many Employees Does Hexagon ADR Have?

Hexagon ADR has 16118 employees.

What Is the HXGBY After Hours Price?

HXGBY's last after hours stock price is 10.31 EUR, the stock has changed by -0.06 EUR, or -0.58%.
Risk Disclosure: Trading in financial instruments and/or cryptocurrencies involves high risks including the risk of losing some, or all, of your investment amount, and may not be suitable for all investors. Prices of cryptocurrencies are extremely volatile and may be affected by external factors such as financial, regulatory or political events. Trading on margin increases the financial risks.
Before deciding to trade in financial instrument or cryptocurrencies you should be fully informed of the risks and costs associated with trading the financial markets, carefully consider your investment objectives, level of experience, and risk appetite, and seek professional advice where needed.
Fusion Media would like to remind you that the data contained in this website is not necessarily real-time nor accurate. The data and prices on the website are not necessarily provided by any market or exchange, but may be provided by market makers, and so prices may not be accurate and may differ from the actual price at any given market, meaning prices are indicative and not appropriate for trading purposes. Fusion Media and any provider of the data contained in this website will not accept liability for any loss or damage as a result of your trading, or your reliance on the information contained within this website.
It is prohibited to use, store, reproduce, display, modify, transmit or distribute the data contained in this website without the explicit prior written permission of Fusion Media and/or the data provider. All intellectual property rights are reserved by the providers and/or the exchange providing the data contained in this website.
Fusion Media may be compensated by the advertisers that appear on the website, based on your interaction with the advertisements or advertisers.
© 2007-2026 - Fusion Media Limited. All Rights Reserved.