Geely Automobile Holdings Ltd (0175)

Currency in HKD
21.26
-0.12(-0.56%)
Closed·
0175 is not included in our AI-picked strategies. See which stocks are.
Fair Value
Day's Range
20.8821.56
52 wk Range
14.9625.62
Key Statistics
Bid/Ask
21.26 / 21.28
Prev. Close
21.38
Open
21.18
Day's Range
20.88-21.56
52 wk Range
14.96-25.62
Volume
61.12M
Average Volume (3m)
86.84M
1-Year Change
11.0763%
Fair Value
unlockUnlock
Fair Value Upside
unlockUnlock
0175 Scorecardpro icon
Company’s Health
Unlock
Fair Value
Unlock Price
Fair Price
Upside
Price Target
29.22
Upside
+37.42%
Members' Sentiments
Bearish
Bullish
ProTips
Has raised its dividend for 3 consecutive years
Show more

Technical Analysis

Summary
Strong Sell
Sell
Neutral
Buy
Strong Buy
Strong Sell
Technical Indicators
Strong Sell
Moving Averages
Sell

Analyst Ratings

29 Buy
2 Hold
0 Sell
Ratings:
31 analysts
Overall Consensus
Strong Buy

Analysts 12-Month Price Target:

Average 29.22
(+37.42% Upside)
Firm
ArticlePositionPrice TargetUpside / DownsideFrom Price TargetActionDate
JPMorgan
Buy28.00+31.70%22.00Maintain04-05-2026
Macquarie
Buy28.00+31.70%-Maintain30-04-2026
Macquarie
Buy28.00+31.70%24.00Maintain28-04-2026
CLSA
Buy30.00+41.11%23.00Maintain21-04-2026
Citi
Buy30.00+41.11%27.00Maintain16-04-2026

Earnings

Latest Release
29-04-2026
EPS / Forecast
0.41 / 1.65
Revenue / Forecast
83.78B / --
EPS Revisions
Last 90 days

Dividends

Payout Ratio
Payout ratio (TTM)
Earnings retained
EPS 1.41%
Dividend Yield
2.20%
Industry Median 1.80%
Annualised payout
0.50
Paid annually
5-Years Growth
+21.69%
Growth Streak

0175 Income Statement

Compare 0175 to Peers and Sector

Metrics to compare
0175
Peers
Sector
Relationship
P/E Ratio
13.9x13.6x10.6x
PEG Ratio
-−0.220.02
Price/Book
2.2x1.2x1.4x
Price / LTM Sales
0.6x0.7x0.9x
Upside (Analyst Target)
27.2%33.0%29.2%
Fair Value Upside
Unlock22.1%11.3%Unlock

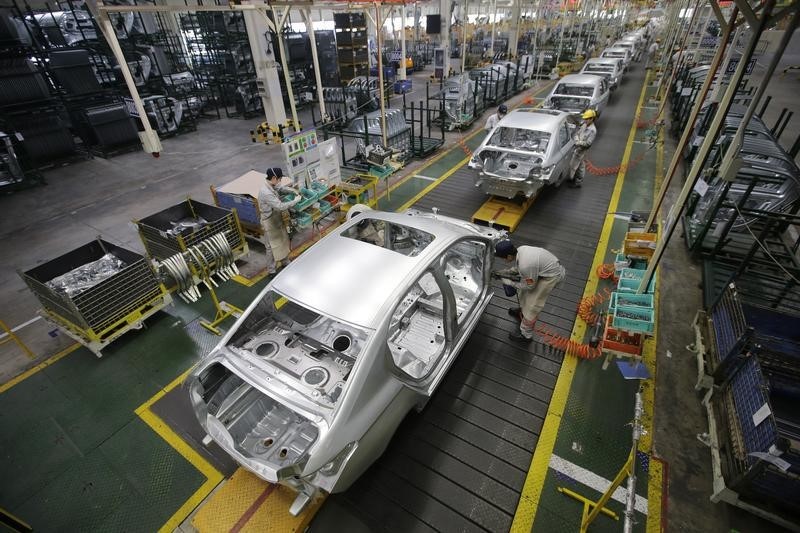
Geely Automobile Holdings Limited, an investment holding company, operates as an automobile manufacturer primarily in the People’s Republic of China. The company engages in the research and development, production, marketing, and sale of passenger vehicles; automobile parts; and related automobile components, including electric powertrain and battery systems, as well as provides related after-sales and technical services. It also offers electric mobility related products under the ZEEKR brand; automotive design, software systems development, modular development, intelligent electric vehicles virtual engineering, and mobility technology solutions; knockdown kits; export of vehicles; automotive-related integrated vehicle services; and provision of general logistic, packing, and storage services. It operates in Eastern Europe, the Netherlands, Sweden, France, the Asia Pacific, the Middle East, Latin America, Africa, and internationally. Geely Automobile Holdings Limited was incorporated in 1997 and is headquartered in Wan Chai, Hong Kong.

Employees
73000
Market
Hong Kong

Ownership

Ownership Overview

Type
Common Stock Held% of Shares OutstandingMarket Value
Mutual Funds & ETFs
1.85B17.10%39.47B
Other Institutional Investors
4.78B44.25%102.15B
Public Companies & Retail Investors
4.17B38.66%89.25B
Total
10.8B100.00%230.88B

Top Holders

Holder
% of holding
Shares Held
Date Reported
Value (In 1,000s)
Zhejiang Geely Holding Group Limited36.57%3,94,94,21,0008,44,38,621
BlackRock, Inc.4.57%49,39,39,8141,05,60,433

FAQ

What Is the Geely Automobile (0175) Share Price Today?

The Geely Automobile share price today is 21.26.

What is the current Geely Automobile (0175) share price and day range?

As of 14-05-2026, the Geely Automobile share price is 21.26, with a previous close of 21.38. The share price has ranged from 20.88 to 21.56 today, while the 52-week range spans from 14.96 to 25.62.

What Is the Geely Automobile Market Cap?

As of today, Geely Automobile market cap is 229.45B.

Does Geely Automobile Pay Dividends? What's The Current Dividend Yield?

The Geely Automobile dividend yield is 2.2%.

What Is the Geely Automobile (0175) Share Price Target?

The average 12-month share price target for Geely Automobile is 29.22, with a high estimate of 36.21537396 and a low estimate of 21.17959372. 29 analysts recommend buying, while 0 suggest selling, with an overall rating of Strong Buy and +37.42% Upside potential.

What Is Geely Automobile's Earnings Per Share (TTM)?

The Geely Automobile EPS (TTM) is 1.41.

When Is the Next Geely Automobile Earnings Date?

Geely Automobile will release its next earnings report on 29-04-2026.

From a Technical Analysis Perspective, Is 0175 a Buy or Sell?

Based on moving averages and other technical indicators, the daily buy/sell signal is Strong Sell.

What Stock Exchange Does Geely Automobile Trade On?

Geely Automobile is listed and trades on the Hong Kong Stock Exchange.

What Is the Stock Symbol for Geely Automobile?

The stock symbol for Geely Automobile is "0175."

How Many Times Has Geely Automobile Stock Split?

Geely Automobile has split 1 times.

How Many Employees Does Geely Automobile Have?

Geely Automobile has 73000 employees.
Risk Disclosure: Trading in financial instruments and/or cryptocurrencies involves high risks including the risk of losing some, or all, of your investment amount, and may not be suitable for all investors. Prices of cryptocurrencies are extremely volatile and may be affected by external factors such as financial, regulatory or political events. Trading on margin increases the financial risks.
Before deciding to trade in financial instrument or cryptocurrencies you should be fully informed of the risks and costs associated with trading the financial markets, carefully consider your investment objectives, level of experience, and risk appetite, and seek professional advice where needed.
Fusion Media would like to remind you that the data contained in this website is not necessarily real-time nor accurate. The data and prices on the website are not necessarily provided by any market or exchange, but may be provided by market makers, and so prices may not be accurate and may differ from the actual price at any given market, meaning prices are indicative and not appropriate for trading purposes. Fusion Media and any provider of the data contained in this website will not accept liability for any loss or damage as a result of your trading, or your reliance on the information contained within this website.
It is prohibited to use, store, reproduce, display, modify, transmit or distribute the data contained in this website without the explicit prior written permission of Fusion Media and/or the data provider. All intellectual property rights are reserved by the providers and/or the exchange providing the data contained in this website.
Fusion Media may be compensated by the advertisers that appear on the website, based on your interaction with the advertisements or advertisers.
© 2007-2026 - Fusion Media Limited. All Rights Reserved.