Deep Industries Ltd (DEEI)

NSE
Currency in INR
442.85
+10.75(+2.49%)
Closed·
DEEI Scorecard
Full Analysis
Has raised its dividend for 4 consecutive years
Unusual trading volume
Fair Value
Day's Range
428.35452.90
52 wk Range
283.60624.40
Key Statistics
Edit
Bid/Ask
442.85 / 442.90
Prev. Close
432.1
Open
430
Day's Range
428.35-452.9
52 wk Range
283.6-624.4
Volume
681.14K
Average Volume (3m)
178.63K
1-Year Change
47.3%
Fair Value
unlockUnlock
Fair Value Upside
unlockUnlock
DEEI Scorecardpro icon
Company’s Health
Unlock
Fair Value
Unlock Price
Fair Price
Upside
Analysts Sentiment
Currently not supported.
Members' Sentiments
Bearish
Bullish
ProTips
Stock price often moves in the opposite direction of the market

Deep Industries Ltd News & Analysis

Show more

Deep Industries Company Profile

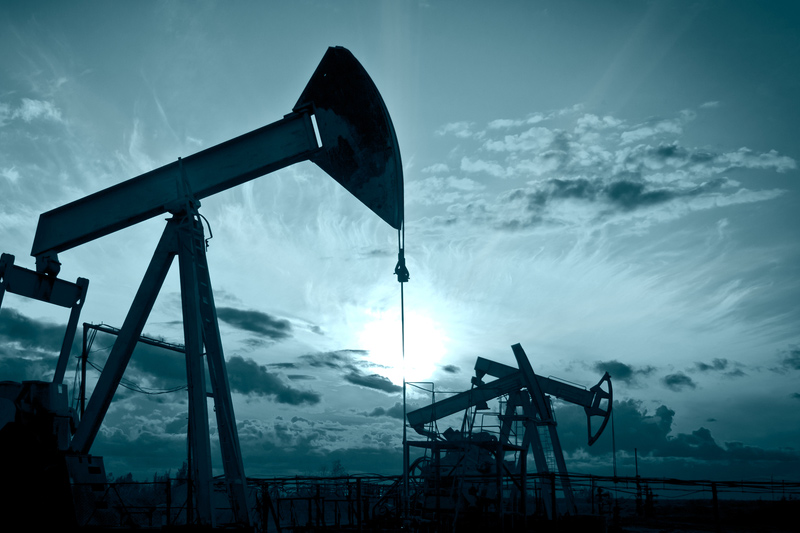
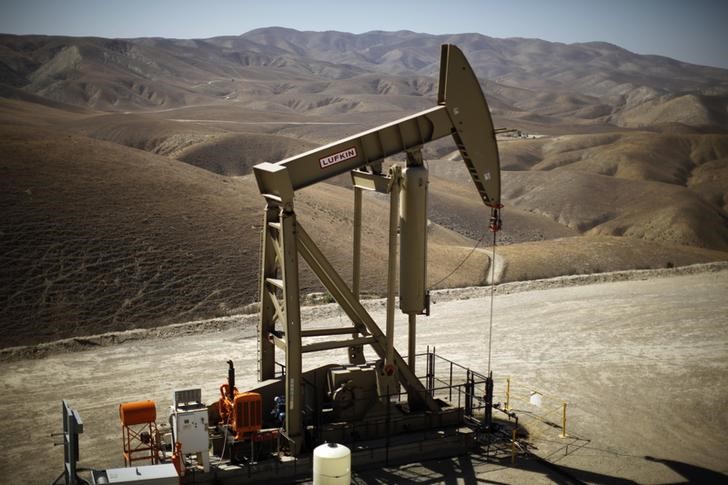
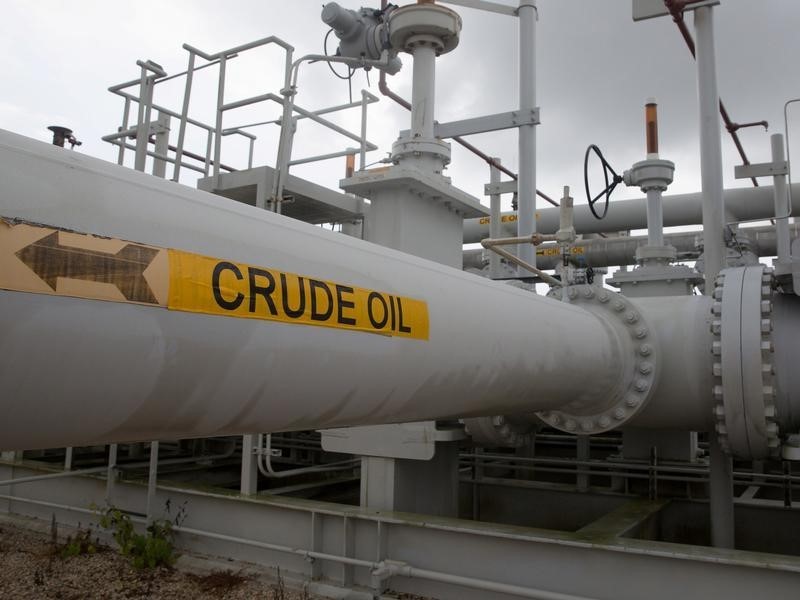
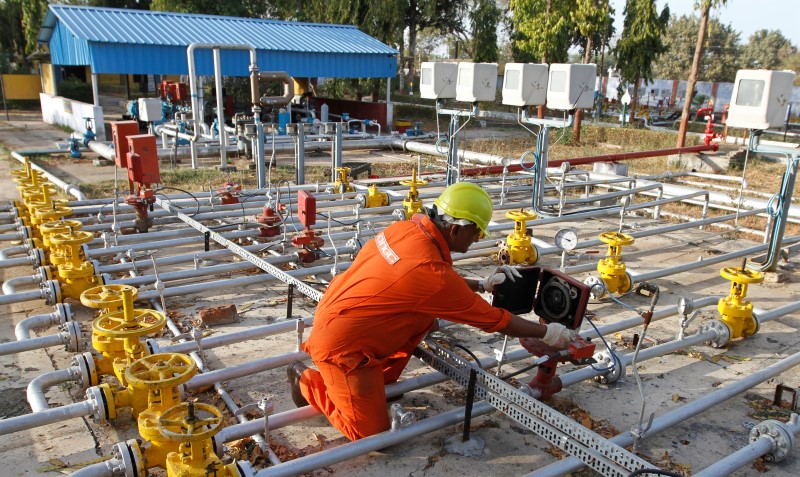
Deep Industries Limited provides oil and gas field services in India. Its services include air and gas compression; drilling and workover; gas dehydration, conditioning, and processing; and integrated project management services, as well as rental and chartered hire of equipment and services. The company was formerly known as Deep CH4 Limited and changed its name to Deep Industries Limited in September 2020. Deep Industries Limited was founded in 1991 and is based in Ahmedabad, India.

Compare DEEI to Peers and Sector

Metrics to compare
DEEI
Peers
Sector
Relationship
P/E Ratio
−31.5x4.2x4.7x
PEG Ratio
0.180.000.00
Price/Book
1.6x1.6x1.1x
Price / LTM Sales
4.9x2.3x1.1x
Upside (Analyst Target)
-20.7%23.8%
Fair Value Upside
Unlock20.8%8.8%Unlock

Dividends

Payout Ratio
Payout ratio (TTM)
Earnings retained
EPS -14.08%
Dividend Yield
0.56%
Industry Median 2.52%
Annualised payout
2.44
Paid annually
5-Years Growth
-
Growth Streak

Earnings

Latest Release
May 02, 2025
EPS / Forecast
-32.68 / --
Revenue / Forecast
1.67B / --
EPS Revisions
Last 90 days

DEEI Income Statement

FAQ

What Is the Deep Industries (DEEI) Stock Price Today?

The Deep Industries stock price today is 442.85.

What Stock Exchange Does Deep Industries Trade On?

Deep Industries is listed and trades on the India National Stock Exchange stock exchange.

What Is the Stock Symbol for Deep Industries?

The stock symbol for Deep Industries is "DEEI."

Does Deep Industries Pay Dividends? What’s The Current Dividend Yield?

The Deep Industries dividend yield is 0.55%.

What Is the Deep Industries Market Cap?

As of today, Deep Industries market cap is 28.34B.

What Is Deep Industries's Earnings Per Share (TTM)?

The Deep Industries EPS (TTM) is -14.08.

From a Technical Analysis Perspective, Is DEEI a Buy or Sell?

Based on moving averages and other technical indicators, the daily buy/sell signal is Strong Buy.

How Many Times Has Deep Industries Stock Split?

Deep Industries has split 1 times.

How Many Employees Does Deep Industries Have?

Deep Industries has 878 employees.

What is the current trading status of Deep Industries (DEEI)?

As of 14 Jun 2025, Deep Industries (DEEI) is trading at a price of 442.85, with a previous close of 432.10. The stock has fluctuated within a day range of 428.35 to 452.90, while its 52-week range spans from 283.60 to 624.40.
Risk Disclosure: Trading in financial instruments and/or cryptocurrencies involves high risks including the risk of losing some, or all, of your investment amount, and may not be suitable for all investors. Prices of cryptocurrencies are extremely volatile and may be affected by external factors such as financial, regulatory or political events. Trading on margin increases the financial risks.
Before deciding to trade in financial instrument or cryptocurrencies you should be fully informed of the risks and costs associated with trading the financial markets, carefully consider your investment objectives, level of experience, and risk appetite, and seek professional advice where needed.
Fusion Media would like to remind you that the data contained in this website is not necessarily real-time nor accurate. The data and prices on the website are not necessarily provided by any market or exchange, but may be provided by market makers, and so prices may not be accurate and may differ from the actual price at any given market, meaning prices are indicative and not appropriate for trading purposes. Fusion Media and any provider of the data contained in this website will not accept liability for any loss or damage as a result of your trading, or your reliance on the information contained within this website.
It is prohibited to use, store, reproduce, display, modify, transmit or distribute the data contained in this website without the explicit prior written permission of Fusion Media and/or the data provider. All intellectual property rights are reserved by the providers and/or the exchange providing the data contained in this website.
Fusion Media may be compensated by the advertisers that appear on the website, based on your interaction with the advertisements or advertisers.
© 2007-2025 - Fusion Media Limited. All Rights Reserved.