Bumi Resources Tbk (BUMI)

Currency in IDR
185
+21(+12.80%)
Closed·
BUMI is not included in our AI-picked strategies. See which stocks are.
Fair Value
Day's Range
160186
52 wk Range
103484
Key Statistics
Bid/Ask
185.00 / 186.00
Prev. Close
164
Open
164
Day's Range
160-186
52 wk Range
103-484
Volume
6.62B
Average Volume (3m)
4.13B
1-Year Change
59.4828%
Fair Value
unlockUnlock
Fair Value Upside
unlockUnlock
BUMI Scorecardpro icon
Company’s Health
Unlock
Fair Value
Unlock Price
Fair Price
Upside
Price Target
301
Upside
+62.78%
Members' Sentiments
Bearish
Bullish
ProTips
Analysts anticipate sales growth in the current year

Bumi Resources Tbk News & Analysis

Show more

Technical Analysis

Summary
Strong Sell
Sell
Neutral
Buy
Strong Buy
Buy
Technical Indicators
Strong Buy
Moving Averages
Neutral

Analyst Ratings

1 Buy
0 Hold
0 Sell
Ratings:
1 analysts
Overall Consensus
Strong Buy

Analysts 12-Month Price Target:

Average 301
(+62.78% Upside)
Firm
ArticlePositionPrice TargetUpside / DownsideFrom Price TargetActionDate

Earnings

Latest Release
30-03-2026
EPS / Forecast
-- / --
Revenue / Forecast
387.47M / --
EPS Revisions
Last 90 days

BUMI Income Statement

Compare BUMI to Peers and Sector

Metrics to compare
BUMI
Peers
Sector
Relationship
P/E Ratio
41.4x19.7x5.8x
PEG Ratio
0.09−0.420.00
Price/Book
2.2x1.8x1.1x
Price / LTM Sales
2.4x1.8x1.5x
Upside (Analyst Target)
83.0%11.6%20.4%
Fair Value Upside
Unlock13.6%7.5%Unlock

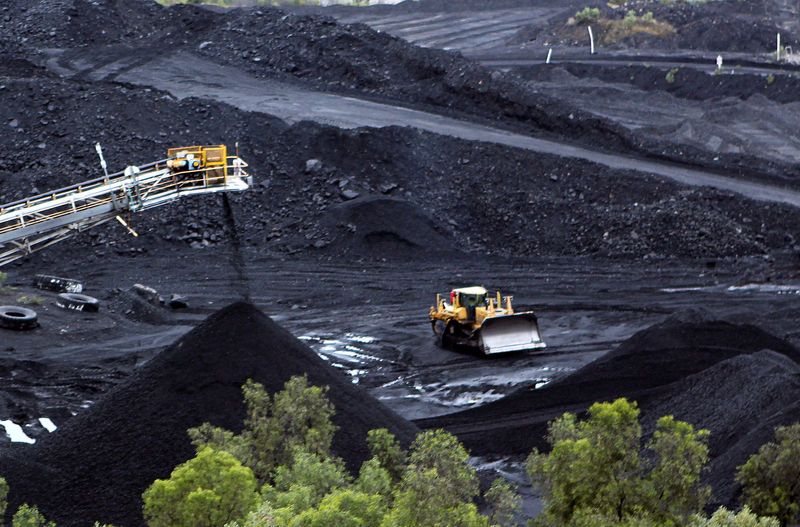
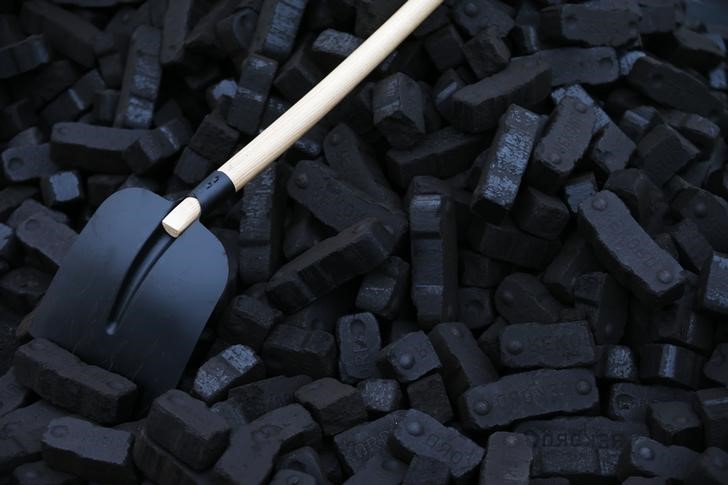
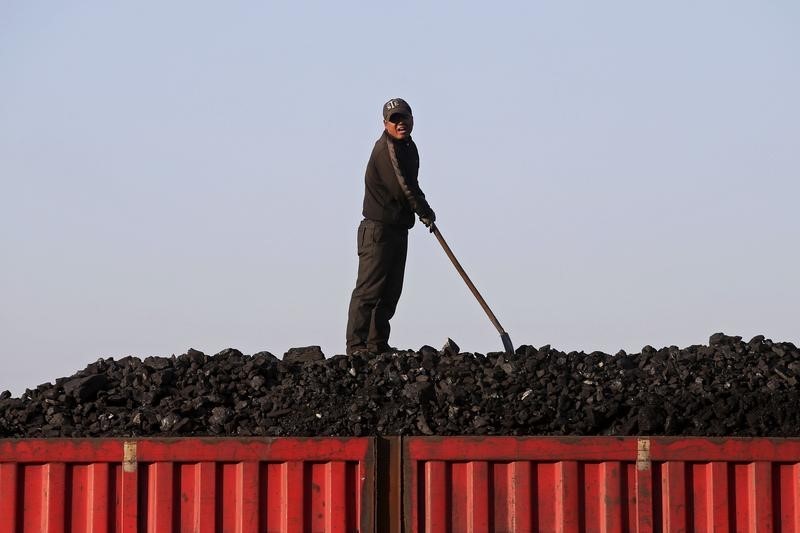
PT Bumi Resources Tbk, together with its subsidiaries, engages in the mining activities in Indonesia. The company operates through three segments: Holding Company, Coal, and Minerals. It engages in the exploration, exploitation, mining, and sale of coal deposits; and explores gold and silver properties. The company also exports its products. The company also exports its products. The company was formerly known as PT Bumi Modern Tbk. and changed its name to PT Bumi Resources Tbk in September 2000. PT Bumi Resources Tbk was founded in 1973 and is headquartered in Jakarta Selatan, Indonesia.

Industry
Coal
Sector
Energy
Employees
1502
Market
Indonesia

Ownership

Ownership Overview

Type
Common Stock Held% of Shares OutstandingMarket Value
Mutual Funds & ETFs
11.03B2.97%1.81T
Other Institutional Investors
240.35B64.73%39.42T
Public Companies & Retail Investors
119.95B32.30%19.67T
Total
371.34B100.00%60.9T

Top Holders

Holder
% of holding
Shares Held
Date Reported
Value (In 1,000s)
Integrated Energy Services Corporation45.78%1,70,00,00,00,00027,88,00,00,000
UBS Asset Management AG5.96%22,13,55,35,3663,63,02,27,800

FAQ

What Is the Bumi Resources (BUMI) Share Price Today?

The Bumi Resources share price today is 185.

What is the current Bumi Resources (BUMI) share price and day range?

As of 22-05-2026, the Bumi Resources share price is 185, with a previous close of 164. The share price has ranged from 160 to 186 today, while the 52-week range spans from 103 to 484.

What Is the Bumi Resources Market Cap?

As of today, Bumi Resources market cap is 68.7T.

What Is the Bumi Resources (BUMI) Share Price Target?

The average 12-month share price target for Bumi Resources is 301, with a high estimate of 301.15146147 and a low estimate of 301.15146147. 1 analysts recommend buying, while 0 suggest selling, with an overall rating of Strong Buy and +62.78% Upside potential.

What Is Bumi Resources's Earnings Per Share (TTM)?

The Bumi Resources EPS (TTM) is 0.

From a Technical Analysis Perspective, Is BUMI a Buy or Sell?

Based on moving averages and other technical indicators, the daily buy/sell signal is Strong Sell.

What Stock Exchange Does Bumi Resources Trade On?

Bumi Resources is listed and trades on the Jakarta Stock Exchange.

What Is the Stock Symbol for Bumi Resources?

The stock symbol for Bumi Resources is "BUMI."

How Many Times Has Bumi Resources Stock Split?

Bumi Resources has split 2 times.

How Many Employees Does Bumi Resources Have?

Bumi Resources has 1502 employees.
Risk Disclosure: Trading in financial instruments and/or cryptocurrencies involves high risks including the risk of losing some, or all, of your investment amount, and may not be suitable for all investors. Prices of cryptocurrencies are extremely volatile and may be affected by external factors such as financial, regulatory or political events. Trading on margin increases the financial risks.
Before deciding to trade in financial instrument or cryptocurrencies you should be fully informed of the risks and costs associated with trading the financial markets, carefully consider your investment objectives, level of experience, and risk appetite, and seek professional advice where needed.
Fusion Media would like to remind you that the data contained in this website is not necessarily real-time nor accurate. The data and prices on the website are not necessarily provided by any market or exchange, but may be provided by market makers, and so prices may not be accurate and may differ from the actual price at any given market, meaning prices are indicative and not appropriate for trading purposes. Fusion Media and any provider of the data contained in this website will not accept liability for any loss or damage as a result of your trading, or your reliance on the information contained within this website.
It is prohibited to use, store, reproduce, display, modify, transmit or distribute the data contained in this website without the explicit prior written permission of Fusion Media and/or the data provider. All intellectual property rights are reserved by the providers and/or the exchange providing the data contained in this website.
Fusion Media may be compensated by the advertisers that appear on the website, based on your interaction with the advertisements or advertisers.
© 2007-2026 - Fusion Media Limited. All Rights Reserved.