MSTC Ltd (MSTC)

NSE
Currency in INR
498.85
-8.55(-1.69%)
Closed·
MSTC Scorecard
Full Analysis
Holds more cash than debt on its balance sheet
High dividend Yield
Fair Value
Day's Range
490.05510.90
52 wk Range
411.101,036.90
Key Statistics
Edit
Bid/Ask
496.70 / 497.00
Prev. Close
507.4
Open
507
Day's Range
490.05-510.9
52 wk Range
411.1-1,036.9
Volume
222.08K
Average Volume (3m)
267.97K
1-Year Change
-44.12%
Fair Value
unlockUnlock
Fair Value Upside
unlockUnlock
MSTC Scorecardpro icon
Company’s Health
Unlock
Fair Value
Unlock Price
Fair Price
Upside
Analysts Sentiment
Currently not supported.
Members' Sentiments
Bearish
Bullish
ProTips
High shareholder yield

MSTC Ltd News & Analysis

Show more

MSTC Company Profile

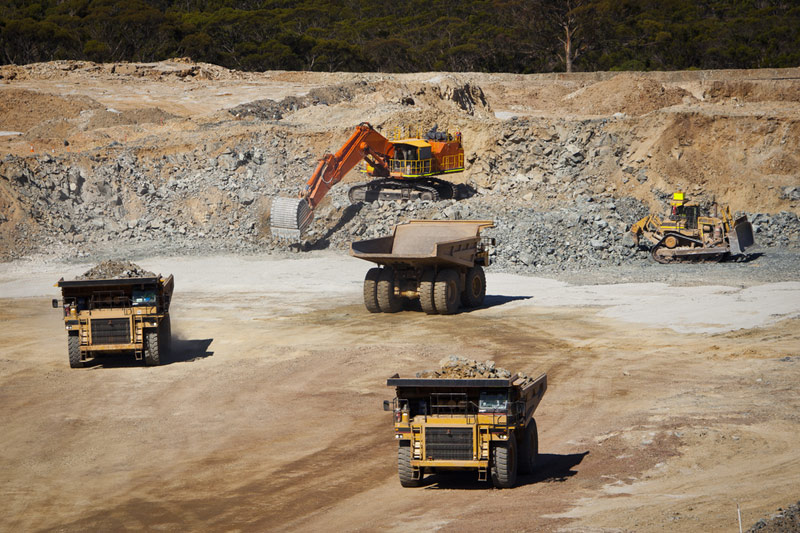
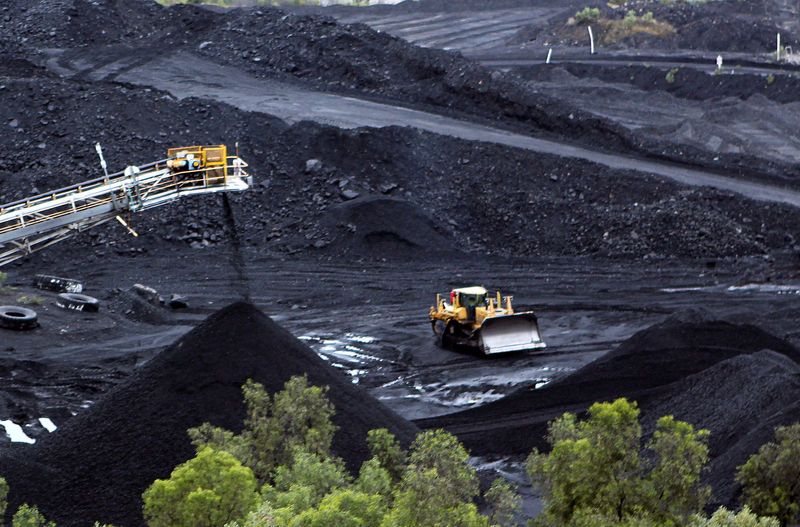
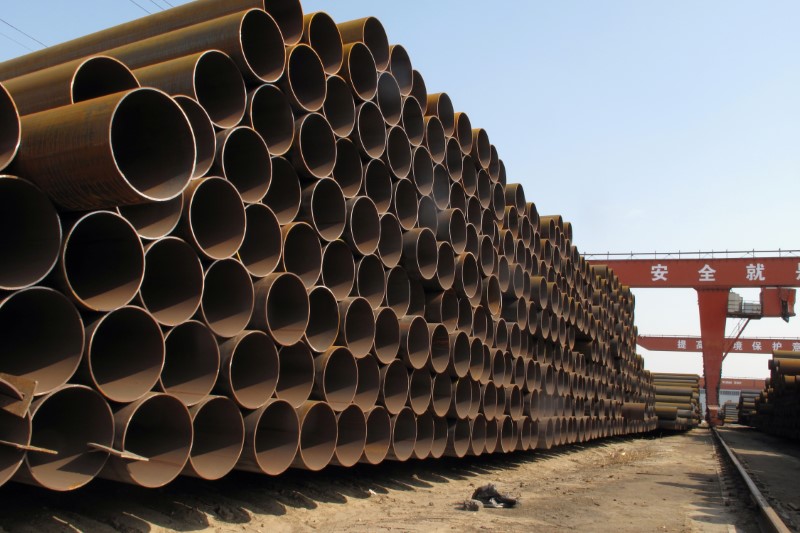
MSTC Limited engages in marketing, e-commerce, and scrap recovery and allied job businesses primarily in India. The company operates in two segments, Marketing and E-Commerce. It is involved in e-procurement, e-auction, and e-sale business. The company also develops ERP solutions comprising of inventory management, personnel and administration, finance and accounts, dashboards, and other packages. In addition, it markets industrial raw materials and project related equipment, as well as engages in disposal of ferrous and non-ferrous scrap, surplus stores, machinery, spares, vehicles, minerals, agriculture, and forest produces. The company was incorporated in 1964 and is headquartered in Kolkata, India.

Employees
290
Market
India

Compare MSTC to Peers and Sector

Metrics to compare
MSTC
Peers
Sector
Relationship
P/E Ratio
8.6x15.1x11.9x
PEG Ratio
0.090.030.03
Price/Book
4.7x1.2x1.4x
Price / LTM Sales
9.0x2.5x1.2x
Upside (Analyst Target)
-15.8%19.0%
Fair Value Upside
Unlock14.4%8.5%Unlock

Dividends

Payout Ratio
Payout ratio (TTM)
Earnings retained
EPS 57.82%
Dividend Yield
8.97%
Industry Median 1.83%
Annualised payout
45.50
Paid unevenly
5-Years Growth
+61.27%
Growth Streak

Earnings

Latest Release
May 29, 2025
EPS / Forecast
10.73 / --
Revenue / Forecast
1.12B / --
EPS Revisions
Last 90 days

MSTC Income Statement

FAQ

What Is the MSTC (MSTC) Stock Price Today?

The MSTC stock price today is 498.85.

What Stock Exchange Does MSTC Trade On?

MSTC is listed and trades on the India National Stock Exchange stock exchange.

What Is the Stock Symbol for MSTC?

The stock symbol for MSTC is "MSTC."

Does MSTC Pay Dividends? What’s The Current Dividend Yield?

The MSTC dividend yield is 9.12%.

What Is the MSTC Market Cap?

As of today, MSTC market cap is 35.72B.

What Is MSTC's Earnings Per Share (TTM)?

The MSTC EPS (TTM) is 57.82.

When Is the Next MSTC Earnings Date?

MSTC will release its next earnings report on 06 Aug 2025.

From a Technical Analysis Perspective, Is MSTC a Buy or Sell?

Based on moving averages and other technical indicators, the daily buy/sell signal is Strong Sell.

How Many Times Has MSTC Stock Split?

MSTC has split 0 times.

How Many Employees Does MSTC Have?

MSTC has 290 employees.

What is the current trading status of MSTC (MSTC)?

As of 19 Jun 2025, MSTC (MSTC) is trading at a price of 498.85, with a previous close of 507.40. The stock has fluctuated within a day range of 490.05 to 510.90, while its 52-week range spans from 411.10 to 1,036.90.
Risk Disclosure: Trading in financial instruments and/or cryptocurrencies involves high risks including the risk of losing some, or all, of your investment amount, and may not be suitable for all investors. Prices of cryptocurrencies are extremely volatile and may be affected by external factors such as financial, regulatory or political events. Trading on margin increases the financial risks.
Before deciding to trade in financial instrument or cryptocurrencies you should be fully informed of the risks and costs associated with trading the financial markets, carefully consider your investment objectives, level of experience, and risk appetite, and seek professional advice where needed.
Fusion Media would like to remind you that the data contained in this website is not necessarily real-time nor accurate. The data and prices on the website are not necessarily provided by any market or exchange, but may be provided by market makers, and so prices may not be accurate and may differ from the actual price at any given market, meaning prices are indicative and not appropriate for trading purposes. Fusion Media and any provider of the data contained in this website will not accept liability for any loss or damage as a result of your trading, or your reliance on the information contained within this website.
It is prohibited to use, store, reproduce, display, modify, transmit or distribute the data contained in this website without the explicit prior written permission of Fusion Media and/or the data provider. All intellectual property rights are reserved by the providers and/or the exchange providing the data contained in this website.
Fusion Media may be compensated by the advertisers that appear on the website, based on your interaction with the advertisements or advertisers.
© 2007-2025 - Fusion Media Limited. All Rights Reserved.