Trump weighs renewed Iran strikes as Saudi airport attack kills 12

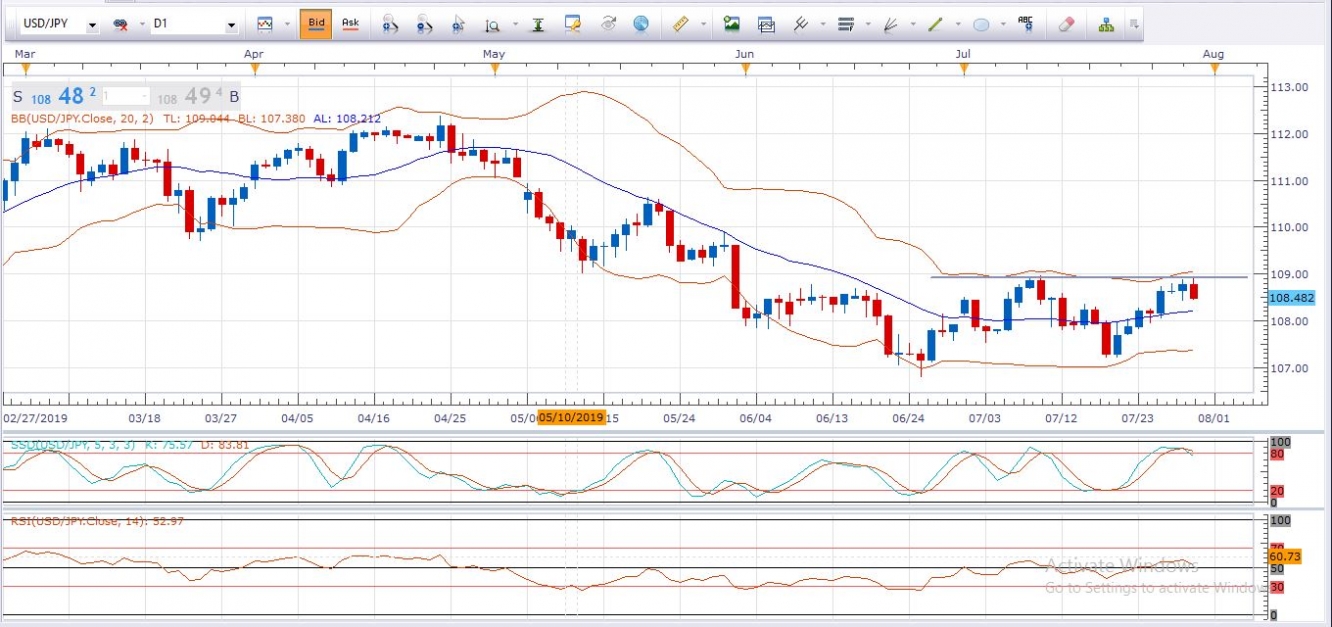
A look at Daily chart of USDJPY pair, we observe that the currency pair is following downtrend scenario where price actions are making lower highs. We observe that price action is making Double top pattern and currently trading near to the second top which is similar to the previous high of 108.36. A double top is an extremely bearish technical reversal pattern that forms after an asset reaches a high price two consecutive times with a moderate decline between the two highs. On the candlesticks chart, we can notice that the price of the pair is currently trading near to the upper band of the Bollinger bands which is indicating that price action might take a downside move considering prices to retest the lower band levels in coming trading sessions.
Applying other technical indicators, Stochastic slow is at 83-Mark which is considered as an overbought territory and is likely to give bearish crossover signal (%K line overlaps %D line). Relative Strength Index is hovering around 53 levels, looks like it has started moving downward.
Conclusion: Above discussed technical indicators have led us to a conclusion of bearishness in the prices in near term and our view is that the prices would retest the 107 mark which is the level of recent support.