Street Calls of the Week

Volatility is one factor that some traders fear while others crave. It is simply a gauge of the magnitude of price movement in the security (irrespective of the direction), meaning the higher the volatility, the higher would be the price movement of a stock. Volatility is a two-sided sword and if not handled with care, can do significant damage to the portfolio but if played well, can also help to rake up some quick gains.
Volatility’s mean-reverting property tells us that if a stock’s volatility increases, it might soon transition to a low volatility regime and vice versa. In other words, if a stock’s volatility is compressed for a long duration, investors can soon expect a sharp move as volatility is expected to expand. However, the direction of the move is difficult to gauge beforehand.
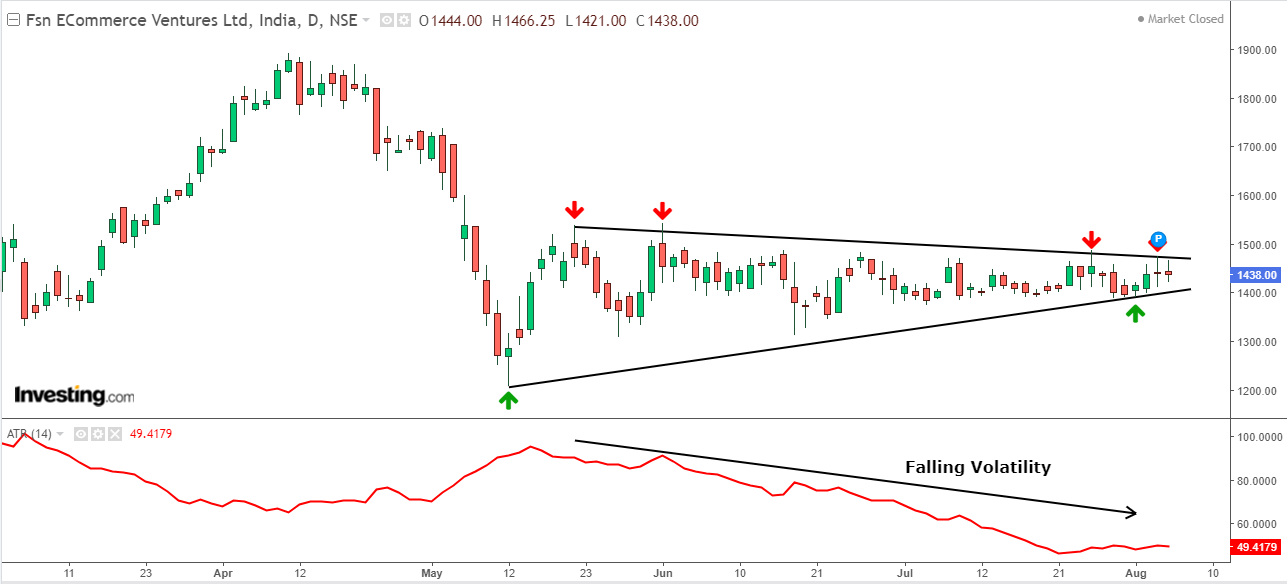
Image Description: Daily chart of Nykaa with ATR at the bottom
Image Source: Investing.com
One stock that almost seems dead for the last few weeks on account of the volatility squeeze, as its movement has almost become negligible is a popular online retailer Fsn ECommerce Ventures Ltd (Nykaa) (NS:FSNE). The stock has been moving in a very tight range for the last many sessions, as investors become indecisive regarding their decisions. This indecision has kept the stock to move in any direction, which is also called a sideways trend.
During this range, the volatility compression seen in the stock is around the historic lows, which makes it an interesting candidate to be added to the watchlist. According to the ATR (daily, 14), the current reading of 49.4 is hovering around the all-time low reading of 46.06, seen last month. These readings show the average movement in the stock for the last 14 days. In other words, a reading of 49.4 could be interpreted as an average movement of 3.4% of the current closing price for the last 14 days (irrespective of the direction).
To give you a comparison, in May 2022, this 14-day average movement shot up to 6.7%, around the same price levels. You can also see the downward trending ATR (red line) on the chart to get a glimpse of falling volatility.
This volatility is soon to expand which would likely wake up the stock, resulting in a sharp one-sided move. However, as the direction is difficult to estimate before the stock starts to move, keeping a close watch on the charts could help. For this, a breakout from the formation of a symmetrical triangle chart pattern could give a reliable indication of the direction of an impending move. This pattern also reflects volatility contraction as both the upper and lower trendlines converge towards each other as they progress, depicting a narrowing of price movement. A breakout on either side of this pattern would likely expand volatility and fuel the stock’s move.